 log in
Here are seven things you may not know about Canada’s mortgage market.
The source: CMHC’s insightful new Residential Mortgage Industry Report.
1) Variable Rates Looked Good (Keyword Being “Looked”)
 Almost 3 in 10 borrowers (29%) went variable in the first quarter. That’s 12 percentage points higher than two years prior. And that’s despite the historically narrow gap between fixed and variable rates.
Coming into 2019, variable mortgages boasted fat discounts, which “partly reflected both expectations of rising interest rates and increasing efforts to attract new borrowers as the housing market [slowed],” CMHC said.
But by March, fixed and variable rates were almost the same.
Historically, fewer people are willing to accept the risk of a floating rate when the fixed-variable spread gets narrow. The fact so many people still chose variables shows, in part, how fewer people now fear rate increases. It also reflected overinflated 5-year fixed rates (most lenders dragged their feet on lowering fixed rates in Q1, despite falling funding costs).
Side note: The difference between the average variable rate and the average 5-year fixed rate in 2018 was just 29 basis points, CMHC says. But CMHC’s survey uses StatsCan rates, which don’t reflect true market rates for qualified borrowers. For example, they quote insured 5-year fixed rates at 3.57% in April. Actual street rates that month were just 2.59% or less. Hopefully CMHC’s future reports use rates that apply to the broader market. Otherwise, they’re just wasting many people’s reading time. Unrealistic rate data certainly doesn’t further the report’s objective: “supporting evidence-based policy and informed decision making within the housing finance sector.”
Things have changed radically since Q1. The gap between 5-year fixed and variable rates last month was the most negative it’s been in decades. It’ll therefore be interesting to see how low variable-rate uptake was in Q2.
2) MFCs and Credit Unions are Key Competitors

The mortgage market is made up of:
- 78% federally-regulated lenders (e.g., banks, trusts and insurance companies).
- 14% provincially-regulated lenders (e.g., credit unions and caisse populaires).
- 6% quasi-regulated lenders (e.g., mortgage finance companies, a.k.a., “MFCs”).
- 2% “unregulated” (e.g., mortgage investment corporations and private lenders).
- This last one seems low given that some sources have estimated private lending at almost 7% of Ontario purchases and 20% of Ontario refinances (a number we cannot fathom). But the 2% reported by CMHC is market share, not originations. If you look at just new mortgages, CMHC suggests private/MIC lenders are growing fast, now accounting for 7% of new borrowing.
Bank challengers remain meaningful competitors:
- “MFC loans count for more than 1 out of 3 mortgage loans in the insured market but approximately 2% of the uninsured market,” CMHC reports.
- That measly 2% is largely because (1) MFCs have small balance sheets, (2) fund most of their mortgages via securitization / selling mortgages to investors (which requires default insurance) and (3) because the government has banned so many types of mortgages from being default insured.
- 82% of non-bank uninsured lending is done by credit unions.
- Side note: The site you’re on remains the only source in Canada tracking rates for every credit union that publicly advertises prime mortgage offers.
3) “MICs” (Almost) Become a Household Word
 New stress-test requirements are driving thousands of borrowers into the arms of incorporated lenders that pool investor money, such as MICs.
Here’s a sampling of MIC facts from the report:
- MICs issue mortgages for 6 to 24 months, just long enough for the borrower to improve their situations and qualify for lower-cost financing elsewhere.
- Their loan-to-values range up to 73% on average, CMHC found.
- 2 in 3 MIC mortgages are first mortgages. The rest are mainly second mortgages, and some third mortgages.
- MIC rates averaged 8.99% in 2018, but some lent as low as 4.50% on first mortgages for strong borrowers.
- Money keeps flooding the MIC industry searching for higher yield. That, in part, has kept rates lower than one might expect given all the new demand since the stress test.
- MIC rates on second mortgages were higher, as you’d expect given the extra risk. MIC second mortgage rates averaged up to 15%.
- Canada’s top 25 MICs held roughly 62% of MIC mortgages, according to the survey.
- B.C. and Ontario dominate MIC lending, accounting for 78% of issued loans.
4) Deposits Underpin Mortgages
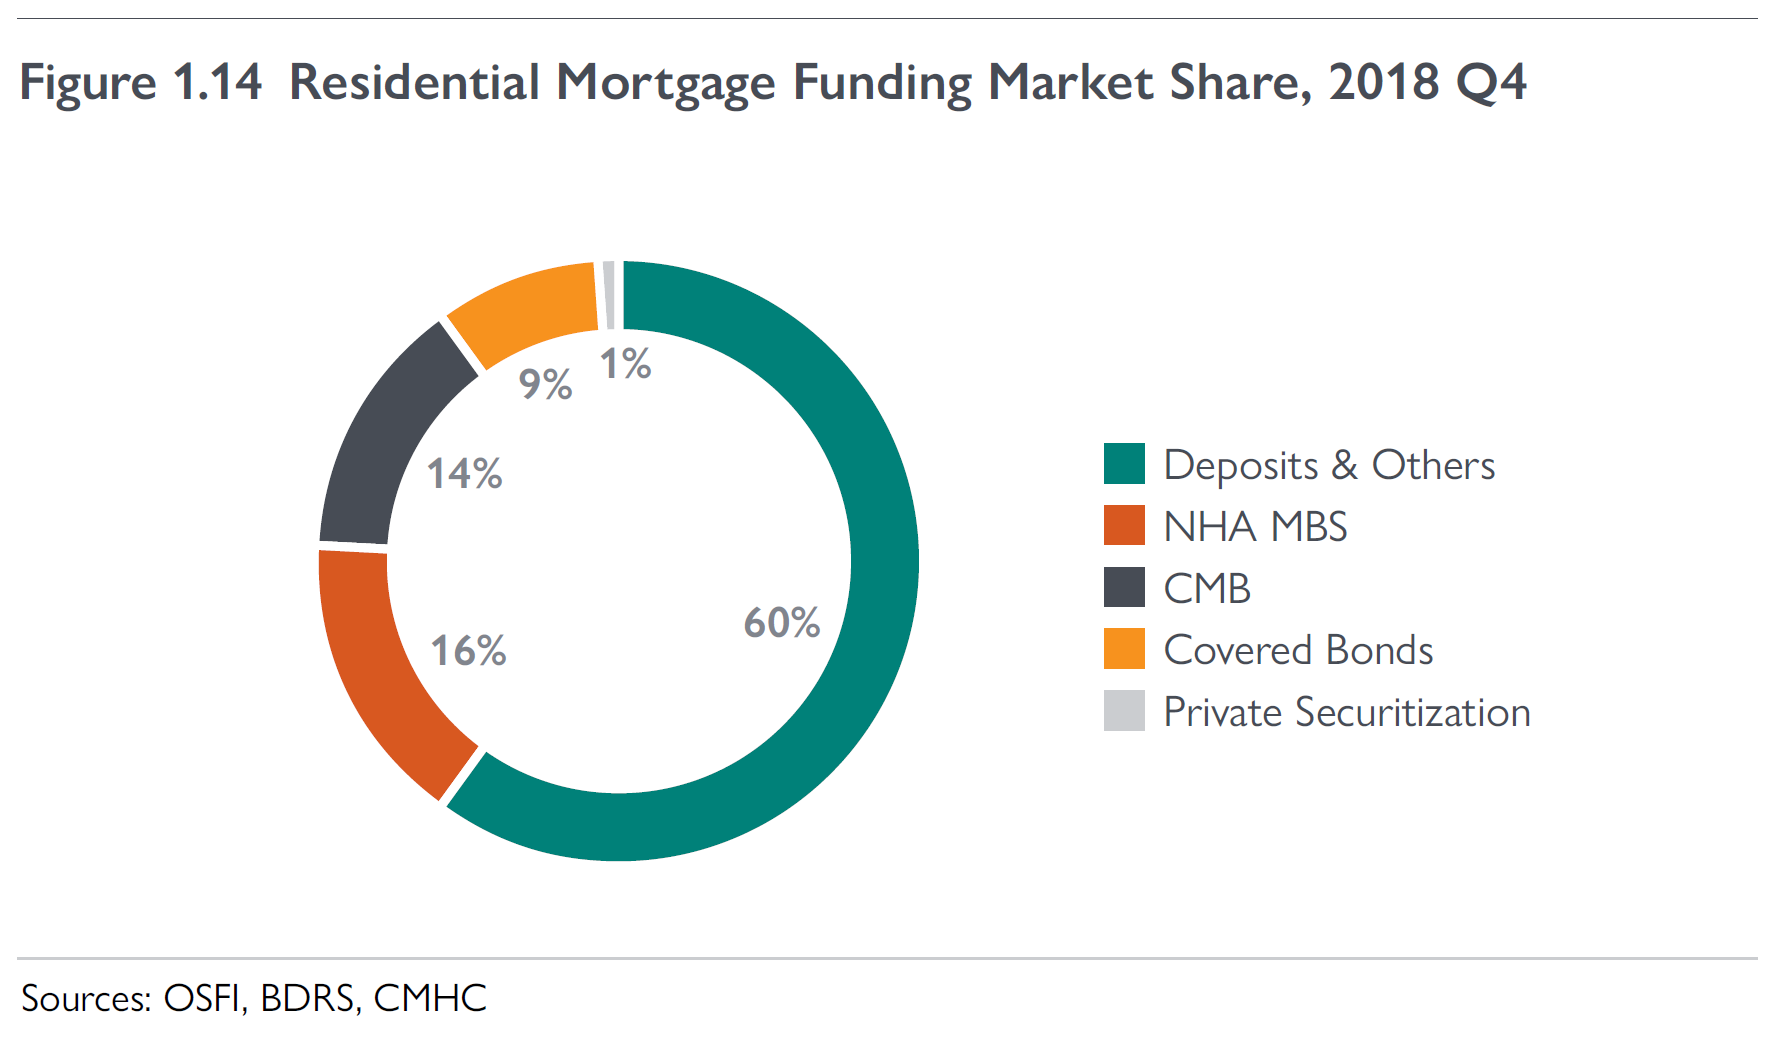
“Deposits remain the primary source of mortgage funding for financial institutions such as chartered banks and credit unions since it is the least expensive source on average,” CMHC says.
Big banks funded over 64% of their residential mortgages with deposits in Q4. Credit unions were even more dependent on deposits, relying on them for almost 4 out of 5 (79%) of their mortgages.
It’ll be fun to watch how deposit funding plays out over the next decade. Depositors are increasingly wise to banks paying peanuts on their chequing and savings accounts. The mortgage-deposit spread should keep compressing until banks can no longer cut costs.
Banks also used covered bonds, a low-cost funding mechanism that smaller lenders can’t tap. Covered bonds fund 1 in 8 bank mortgages. Only eight lenders in Canada can access covered bonds due to the scale, assets and credit ratings required to issue such securities.
 MFCs, those all-important lenders driving rate competition (along with online direct-to-consumer lenders), rely heavily on public securitization programs. Examples of MFCs include MCAP, XMC Mortgage, CMLS and RFA Mortgages.
In Q4, MFCs used NHA mortgage-backed securities for 54% of their funding and Canada Mortgage Bonds for 30% (excluding whole loan sales). Maintaining access to fairly priced default insurance and securitization is essential for MFCs, but policy-makers instead bowed to pressure to reduce Ottawa’s participation in the mortgage market. The result: nominal reductions in the tail risk of an insurer bailout in exchange for guaranteed rate increases for consumers.
Despite government attempts to force lenders into more private funding, by way of new regulations and insurance premium hikes, its strategy has been an unmitigated failure so far. Private securitization represented a scant 1% of residential mortgage funding as of December 31, 2018. And it was dropping fast.
“The lack of RMBS activities is primarily due to its less competitive cost of funds versus other funding options, which is in turn caused by the limited investor demand for this emerging funding channel and the lack of mortgage performance data to allow investors to adequately assess the securities’ risk profile.”
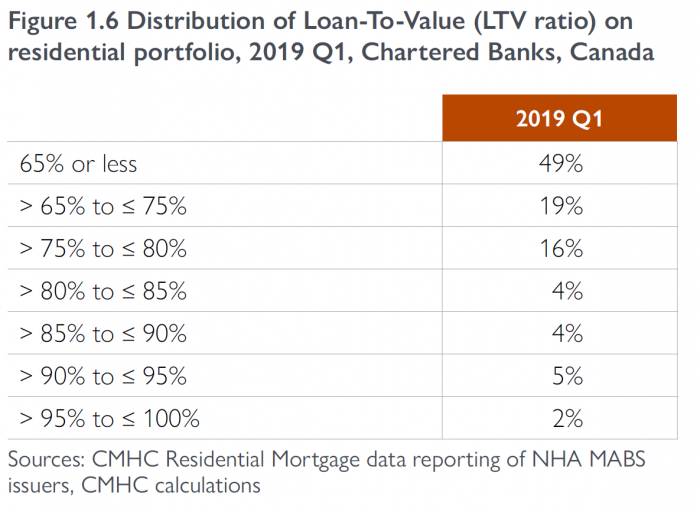
5) Equity Ratios Remain Strong
Canadian mortgages, as a whole, are ultra low-risk from the lender’s standpoint. That’s partly because people have so much equity in their homes, as this chart demonstrates.
Only a very small portion of government-backed insured mortgages are high value. In fact, just 1 in 6 insured mortgages were for more than $500,000 at the time of borrowing.
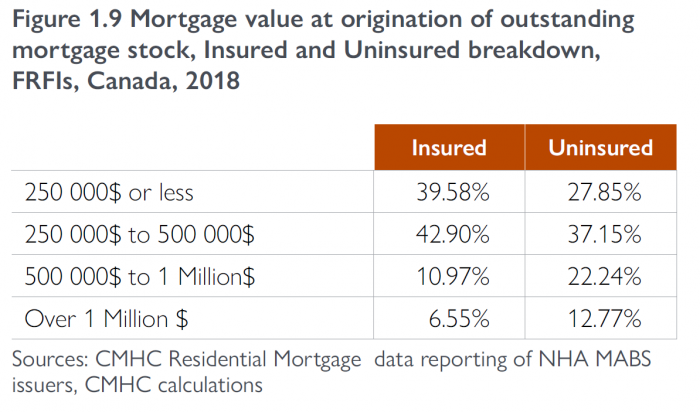
Since the 2016 insurance rule changes, high-dollar (jumbo) mortgages have largely shifted to the uninsured market, creating somewhat more risk for lenders in an economic shock.
 6) 2018 Was a Tough Year for the Industry
Mortgage volumes for home purchases plunged almost 20% last year. The usual suspects are largely to blame: the 2018 stress test, steeper interest rates and persistently high home prices.
One area where lenders weren’t hurting was customer retention. Renewals with the same lender surged 16% in 2018. In other words, lenders are clinging to borrowers like grim death. “…Factors that may have contributed to large increases in loan renewals with the same institution are the tighter approval criteria [and declining approval rates] and limited growth potential of new business,” CMHC said.
In other words, the stress test has trapped a percentage of borrowers with their lender and prevented them from shopping around for better rates.
“Mortgage switches between institutions, which include refinances and renewals with a different lender…increased by 28% in 2018 compared to the same period in 2017,” the housing agency noted. While representing only 6% of all mortgages, bank challengers like mortgage finance companies saw big gains in these customers. That’s especially true for those MFCs (e.g., MCAP and CMLS) that pay the borrower’s switching costs if the mortgage is a collateral charge, something that’s not the norm.
7) Insured Mortgages Skid Further
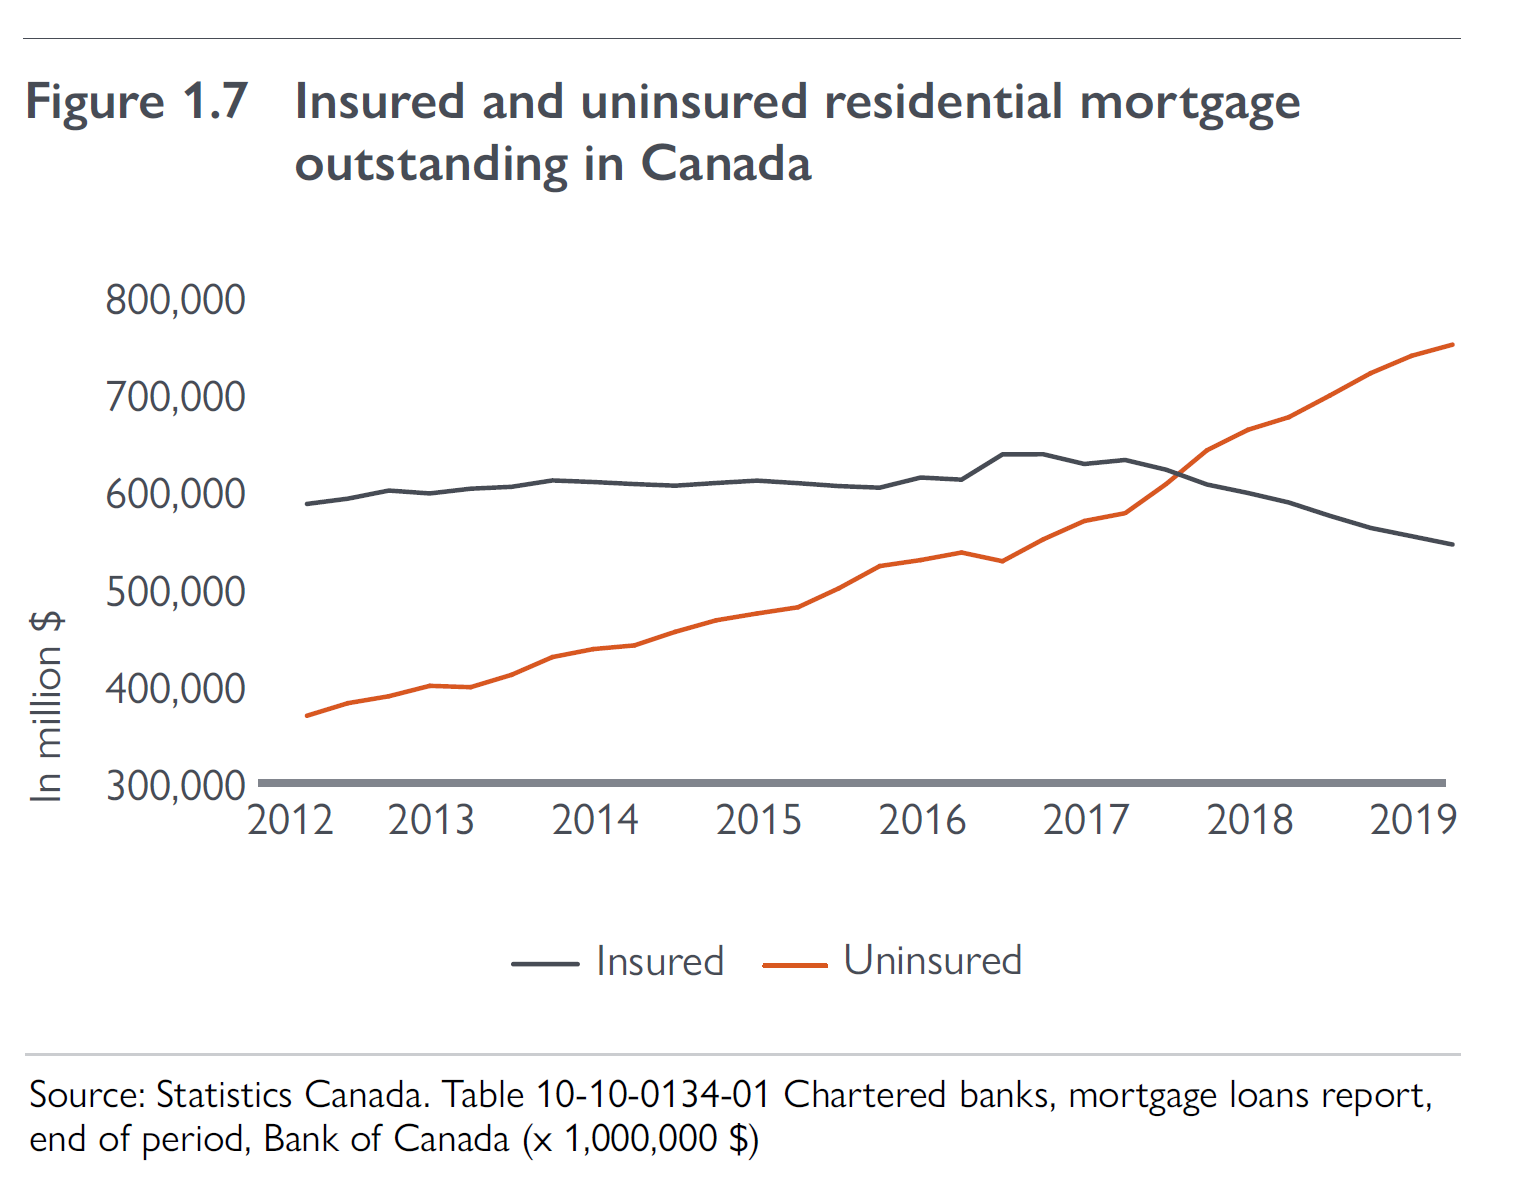

- It was “partly a result of lenders and borrowers adjusting to regulatory changes, notably the 2016 stress testing for high-ratio mortgages, as well as changing economic conditions,” noted CMHC.
- “Changes to the portfolio insurance program have also impacted the relative size of the insured mortgage space.” Said changes included banning various mortgage types from being insured, including:
- 30-year amortizations (which were “extremely popular” CMHC says)
- homes over $1 million
- refinances
- rental properties.
- The “purpose test,” which mandated that bulk insurance be used only for government securitization programs. This too made a dent in insurance usage.
For more facts and figures see CMHC’s Residential Mortgage Industry Report

4 Comments
Thanks for your comprehensive and insightful analysis of the CMHC report! As a layman reading the report some of the figures were interesting, but not so useful without proper context.
I also found the 2% estimate for unregulated lender market share to be quite low (and the 20% estimate for Ontario that you also cited, too high). This appears to be a goldilocks tale, where the truth is likely somewhere in the middle.
3.57% for a 5 year fixed? WTF. Are they using posted rates?
Appreciate that Michael
Skywalker, No clue man (other than to say, they’re not 5yr posted rates).