By The Spy on
December 11, 2015
The latest mortgage rate intel… Variable rates. The fix is in?: Variable rates have gone vertical, ramping up 25-35 basis points in a matter of weeks. It seems like every 6-7dayswe’re hearing banks cut discounts from prime by another 5 bps or so. This week wasno exception. Sure, the banks have faced an array of funding cost pressures, but nothing...
read more
By The Spy on
November 12, 2015
Those of you shopping for a mortgage can be forgiven forcursing the Federal Reserve.The U.S. Fed is hinting that December will mark its first rate hike in nine years. Most interest rate traders are thinking it’s a done deal, which in turn is pushing upCanadian mortgage rates. Have a look at what Canada’s 5-year bonds have been up to lately....
read more
By The Spy on
October 21, 2015
In recentweeks, lenders’ funding costs for variable-rate mortgageshave jumped up to one-tenth of a percentage point. That’slargely due to higher-perceived credit risk in the overall financial markets. Being the profit-seeking enterprises they are, lenders have passed alongthat bump-up in costs to new borrowers.That means you’ll now pay roughlyprime — 0.75% to prime — 0.85% for the most competitive variable ratesin...
read more
By The Spy on
September 7, 2015
Lenders’ funding costs in the fixed-rate market have been trending up for two weeks. Yetstill,we’ve seen a small dip in the best 5-year fixed rates.Variable rates have beenmostly unchanged. For risk-tolerant borrowers: 2-year terms under 2.00% provide an excellent combination of refinance flexibility and up-front rate savings. They’re also appealing for those who want to enjoy today’s historically low rates...
read more
By The Spy on
July 4, 2015
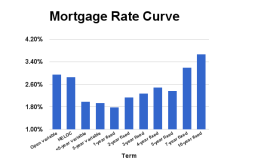
The chart below shows the average best rates for each mortgage term on RateSpy.com. It provides a good sense of rate premium you’ll pay for the security of a fixed rate and/or longer term. Trendsfrom the last 30 days The 5-year fixedis the most-chosenterm in Canada. Its uptake is slowly declining, however, as more Canadians anticipate that low rates will...
read more
By The Spy on
June 7, 2015
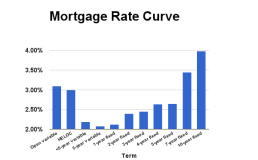
The chart below shows the average best rates for each mortgage term on RateSpy.com. This graph provides a sense of how much of a rate premium you’ll pay for the security of a longer-term and/or fixed rate. Key Takeaways from the last 30 days The most popular term in Canada is still (no surprise) the 5-year fixed. Those rates start...
read more
By The Spy on
May 8, 2015
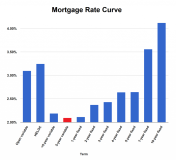
The chart below shows the average best rates for each mortgage term on RateSpy.com. This graph provides a sense of how much of a rate premium you’ll pay for the security of a longer-term and/or fixed rate. Key Takeaways The difference (spread) between 5-year fixed and variable rates has shrunk in recent weeks to roughly0.39percentage points. That’s far less than...
read more
By The Spy on
March 6, 2015
The chart below shows the average best rates for each mortgage term on RateSpy.com. This graph provides a sense for how much of a rate premium you’ll pay for the security of a longer-term and/or fixed rate. Key Takeaways: The difference (spread) between 5-year fixed and variable rates remains tight by historical standards at roughly 0.44 percentage points. The long-term...
read more
By The Spy on
January 16, 2015
The chart below shows the average best rates for each mortgage term on RateSpy.com. This graph provides a sense for how much of a rate premium you’ll pay for the security of a longer-term and/or fixed rate. Key Takeaways: The difference (spread) between 5-year fixed and variable rates remains narrow by historical standards at roughly 0.57 percentage points. The long-term...
read more
By The Spy on
November 17, 2014
The chart below shows the average best rates for each mortgage term on RateSpy.com. The graph provides a sense for how much of a rate premium you’ll pay for the security of a longer-term and/or fixed rate. Key Takeaways: The difference (spread) between 5-year fixed and variable rates remains tight by historical standards at roughly 0.55 percentage points. The long-term...
read more
 log in