 log in
If you ever wondered what bond yields would do if we were facing a potential nuclear holocaust, we’re getting a small taste of it today.
We are seeing Canada’s 5-year yield, normally a key driver of fixed mortgage rates, crash for the second week in a row.
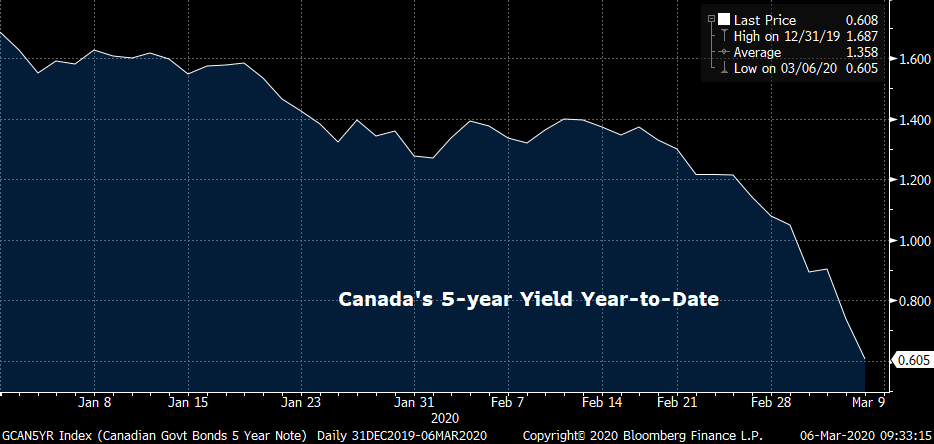
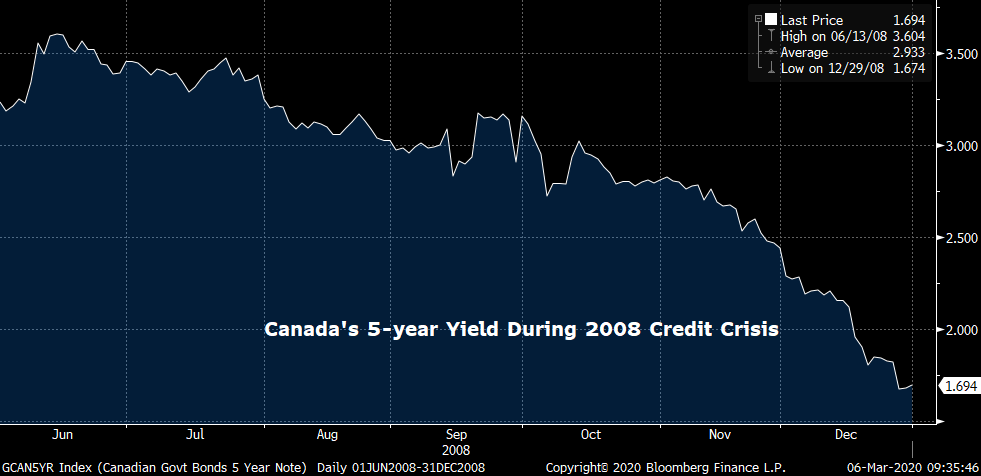
This plunge in yields is eerily reminiscent of the vicious 2008 credit crisis, despite the differing degree and timeframes.
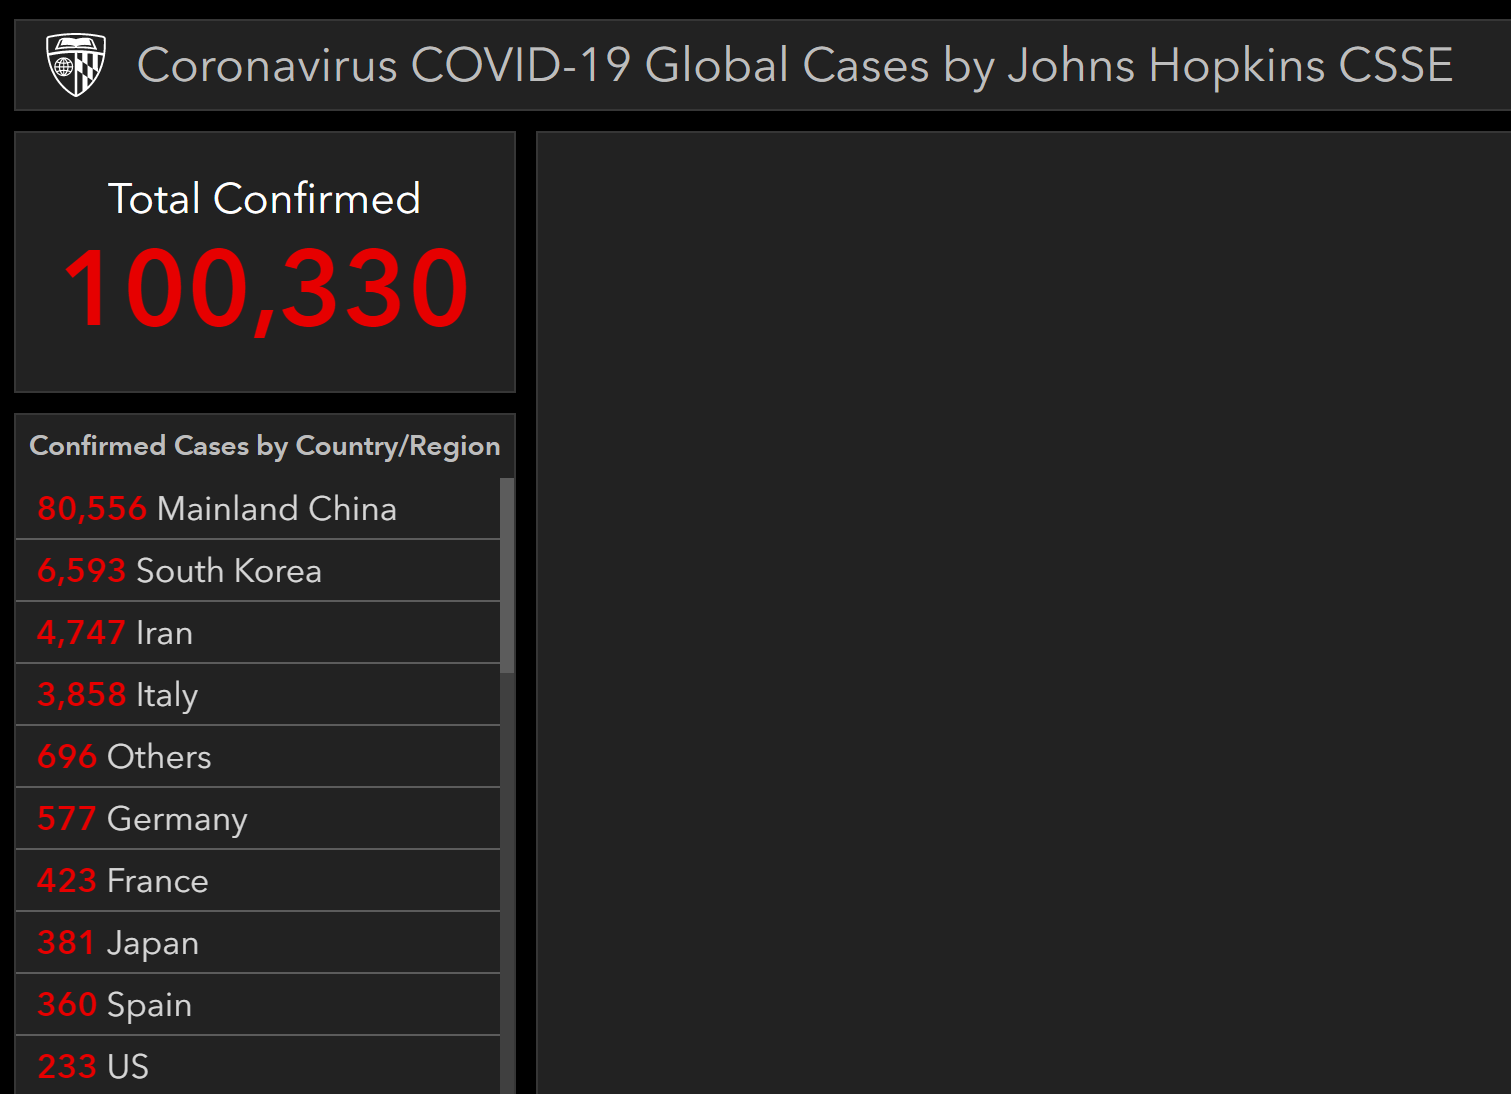
The market is keying off of new ominous coronavirus headlines and cases exceeding 100,000 globally for the first time.
The bond market believes U.S. rates will now go to zero. So why wait? Traders are buying government bonds indiscriminately (bond prices and bond yields move inversely) and that’s hammering rates.
Not even robust employment data in the U.S. and Canada this morning could prop yields up. The market knows unemployment numbers are a trailing indicator and is seeing right through them.
Looking Ahead
There’s almost no question we’ll get more Bank of Canada rate cuts.
Financial markets are pricing in a 0.50% Bank of Canada policy rate by this fall, down 75 basis points from today. Investors are projecting U.S. rates near zero by year-end. (Source: Bloomberg overnight index swap data)
If our quick anecdotal survey of three mortgage brokers and three lenders is any indication, mortgage shoppers are increasingly watching this plunge in rates and applying for variables.
Had the banks not passed through the full BoC rate cut to consumers—by way of lowering their prime rates—the stampede to variable-rate mortgages might not be so pronounced. But given that Canada’s banks played ball, floating-rates will continue to gain market share for the foreseeable future.
As we speak, the lowest conventional:
- Variable rates are:
- 2.25% (Ontario)
- 2.34% (everywhere else)
- 5-year fixed rates are:
- 2.39% (AB, BC, ON)
- 2.49% (everywhere else)
Variable rates should eventually break away from 5-year fixed rates—i.e., fall faster than fixed rates. But we’re still waiting on most lenders to cut their 5-year fixed rates. They’re nervous about doing that until the volatility subsides. But if Canada’s 5-year yield stays under 1%, they’ll eventually have no choice.

10 Comments
For people getting a mortgage at TD or BMO, I think variables are a slam dunk. TD lets you lock into a 3-5yr fixed at any time with no penalty. BMO lets you lock into a fixed with a term equal or longer than your remaining term. In my experience BMO doesn’t limit you to their posted rates; they give you their lower discretionary rates that when you lock in.
My closing date is April 15, 2020.
My current offer @ Scotia eHome is a 5-Year fixed rate @ 2.29% for 30-year amortization.
Would your advice be to stick with it or wait longer for most lenders to cut their 5-year fixed rates?
Thanks,
Josh
Check again Josh. In my test account I saw lower on eHOME yesterday, although eHOME rates are borrower dependent.
In general, there’s a good chance rates could fall more from here, but other factors will determine if it’s advisable to wait (like one’s closing date, how closely they follow the market, etc.). Note that most lenders let you reset your rate if their pricing improves before you close. But check with your mortgage advisor or lender to confirm.
Always been a big fan of this site (and CMT before), but I must say that comparing two graphs of bond yields, as has been done above, with different scaling for both the X and Y axes of the two graphs, is really misleading (not saying that was intended, but is the result nonetheless). I’m also not saying that the point made isn’t valid, just how the evidence is presented.
Thanks for being a fan Anthony. They’re just quick charts with no intent other than to show people what happened in each case. The timeframes and yield axes are clearly displayed so people can readily assess them. Note that the time interval for each move is different, but that’s not misleading, that’s simply the reality of the speed by which information dissemination is occurring in the current crisis. We could have shown a seven month chart in each case but the data before Jan 1, 2020 is irrelevant with respect to the coronavirus.
Cheers…
At this point, is it better to get a variable rate?
Hi Chloe, We can’t make individual recommendations on this site but for most well-qualified borrowers, the answer is probably. But see this first: https://www.ratespy.com/fixed-or-variable-rate-the-decision-checklist-02223752
Hi Spy,
I get that–that’s why I wanted to make clear I wasn’t trying to judge intent here. My basic point is that when you say two things are comparable, and then show two graphs that on the surface look very similar, most people aren’t going to notice that the graphs are in fact quite different.
It’s a chronic problem when it comes to presenting information–unfortunately most people don’t have or don’t take the time to dig into the details.
In any case, still a fan! 🙂
Thanks Anthony, On a broader note, there are obvious parallels between the 2008 crisis and today, hence the comparison. And while the credit crisis of late 2008 was a more ferocious beast than what we’re seeing today, that can change. It’s interesting to note that 5-year Canadian yields, on a percentage basis, are down more (61%) and down faster (two months) than what we saw in 2008 (-40% over 3.5 months, from the date of the Lehman collapse).
Well almost all the inversion has been beaten out of the yield curve.
In fact it is almost flat. (yes it is still inverted from 6 months to 5 years)
.952% on 3 month t-bills and 1.165% on 30 yr bonds.
Not much of a premium to lock your money up for an extra 29 years and 9 months.
Do you know when this has happened in the past?